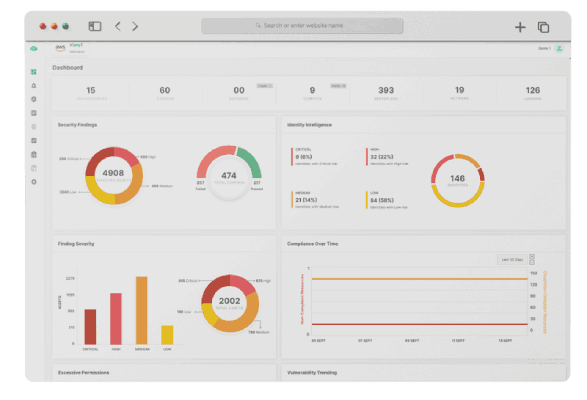
Prometheus Integration with CloudDefense.AI
Integrating Prometheus with CloudDefense.AI is great as it allows real-time monitoring, alerting, and analysis of security vulnerabilities and threats within your cloud infrastructure.
Integration of Prometheus with CloudDefense.AI
What is Prometheus?
Prometheus is an open-source monitoring and alerting toolkit designed for applications, services, and infrastructure in cloud-based environments. It collects and stores time-series data and allows users to query and analyze it in real-time. Prometheus provides a flexible and scalable solution for monitoring various metrics, such as resource usage, application performance, and system health.
Benefits of integrating Prometheus with CloudDefense.AI
Integrating Prometheus with CloudDefense.AI brings a range of benefits to the security of cloud infrastructure and applications. First, Prometheus enables the monitoring of key metrics and security-related events, allowing for the detection of anomalies or potential security breaches in real-time. This proactive approach helps prevent and mitigate security incidents.
Second, the integration with CloudDefense.AI leverages the advanced analytics capabilities of Prometheus, enabling deeper insights into security threats and trends. By combining the power of Prometheus with CloudDefense.AI's machine learning algorithms and threat intelligence, organizations can identify potential vulnerabilities and risks more effectively.
Lastly, Prometheus integration provides seamless integration with existing cloud-native tools and workflows, enabling faster incident response and remediation. The combined solution empowers organizations to adopt a DevSecOps approach, where security is built into the development and deployment lifecycle, rather than being an afterthought.
How does CloudDefense.AI secure your cloud infra and applications?
CloudDefense.AI enhances cloud infrastructure and application security through a range of DevSecOps tools and techniques. Firstly, it scans code repositories, including version control systems, to identify vulnerabilities, insecure coding practices, and potential security flaws. This allows developers to address these issues early in the software development process.
Secondly, CloudDefense.AI scans web applications for potential security vulnerabilities and misconfigurations. By leveraging static and dynamic analysis techniques, it identifies common web application vulnerabilities such as SQL injections, cross-site scripting (XSS), and insecure server configurations. This helps organizations to proactively secure their web applications and protect sensitive data.
Moreover, CloudDefense.AI integrates with cloud security tools like Cloud Infrastructure Entitlement Management (CIEM) and Cloud Security Posture Management (CSPM). It continuously monitors and audits cloud resources, configurations, and access privileges, ensuring compliance with security best practices and policies.
Finally, CloudDefense.AI employs an attack graph that maps the logical connections between different components in a cloud environment. This helps security teams to visualize potential attack paths and prioritize remediation efforts effectively. By identifying critical attack vectors, organizations can take proactive steps to secure their cloud infrastructure and applications.
Instructions for integrating Prometheus with CloudDefense.AI
Prometheus installation with CloudDefense.AI's dev sec ops platform is simple and efficient. It provides seamless integration, allowing for easy monitoring and alerting of security breaches, ensuring robust protection for your applications and infrastructure.
Book A Live Demo
Integrating your cloud infrastructure with Prometheus and the CloudDefense.AI platform is a seamless process, enabling comprehensive security monitoring and strong threat detection capabilities. Prometheus is an open-source monitoring solution designed for highly scalable and reliable metrics collection and alerting in modern cloud environments.
Book A Live Demo


