Grafana Integration with CloudDefense.AI
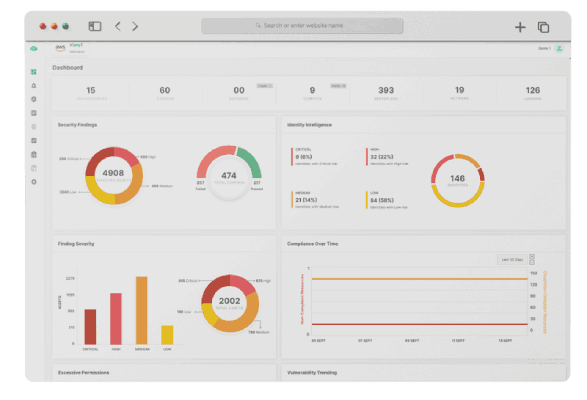
Integrating Grafana with CloudDefense.AI empowers real-time visualization and monitoring of your cybersecurity data, facilitating informed decision-making and enhancing overall security effectiveness.
Integration of Grafana with CloudDefense.AI
What is Grafana?
Grafana is an open-source analytics and visualization platform that allows you to query, visualize, and understand your metrics, regardless of where they are stored. It provides a user-friendly interface for creating and sharing dynamic dashboards and graphs. Grafana supports a wide range of data sources, including popular monitoring systems like Prometheus, Graphite, and InfluxDB, as well as cloud platforms like AWS CloudWatch and Microsoft Azure Monitor.
Benefits of integrating Grafana with CloudDefense.AI
Integrating Grafana with CloudDefense.AI brings several advantages to your cybersecurity practices. Firstly, Grafana's rich visualization capabilities enable you to get a detailed understanding of your security metrics, making it easier to identify patterns, anomalies, and potential threats. Additionally, Grafana's alerting system allows you to set up real-time notifications based on specific conditions or thresholds defined in your security monitoring. This enables you to proactively respond to security incidents and take appropriate actions to mitigate risks.
How CloudDefense.AI helps secure your cloud infra and applications
CloudDefense.AI goes beyond traditional security measures by leveraging DevSecOps tools to provide comprehensive protection for your cloud infrastructure and applications. The platform scans code in repositories, ensuring that any vulnerabilities or misconfigurations are identified and remediated before they can be exploited. It also scans web applications, detecting and flagging any potential weaknesses or vulnerabilities in their code. Additionally, CloudDefense.AI integrates with cloud tools like Cloud Infrastructure and Configuration Vulnerability Management (CIEM and CSPM) to ensure that your cloud environment is properly configured and free of any security risks. The platform also utilizes attack graphs and other advanced techniques to provide a visual representation of your network's attack surface, helping you identify potential attack paths and prioritize security measures.


Instructions for integrating Grafana with CloudDefense.AI
Installing Grafana in CloudDefense.AI's dev sec ops platform is a breeze, offering a user-friendly interface that enables seamless data visualization and monitoring. Its lightweight and flexible nature make it an indispensable tool for effective cybersecurity analysis and decision-making.
Book A Live Demo
Integrating cloud infrastructure with Grafana and CloudDefense.AI is a breeze, providing seamless visualization and security monitoring. Grafana is a powerful open-source platform that allows users to create, explore, and share interactive dashboards with a vast variety of data sources.
Book A Live Demo